Introduction
Understanding how visitors interact with your website is key to improving user experience and boosting conversions. While traditional analytics tools provide valuable data on metrics like page views and bounce rates, they often lack the depth needed to truly grasp user behaviour. This is where heatmaps come in.
Heatmaps offer a visual representation of user interactions, helping you see what’s working and what isn’t. They reveal patterns such as where users click, how far they scroll, and which areas attract the most attention. By leveraging heatmaps effectively, you can make data-driven decisions that enhance usability and drive business growth.
What are heatmaps?
A heatmap is a graphical representation of data where values are depicted using colour intensity. In the context of website analytics, heatmaps help illustrate user activity, making it easier to identify behaviour patterns at a glance.

There are several types of heatmaps, each serving a unique purpose:
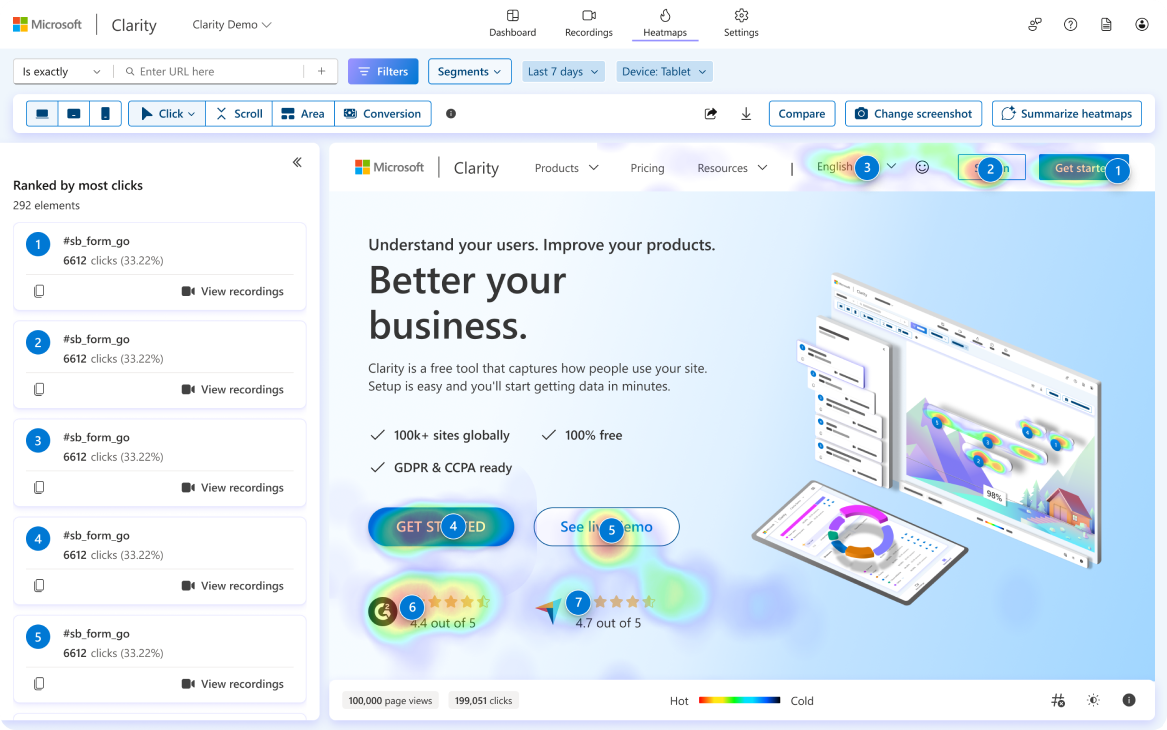
- Click heatmaps – These show where users are clicking the most. These are useful for evaluating the effectiveness of buttons, links, and call-to-action (CTA) placements.
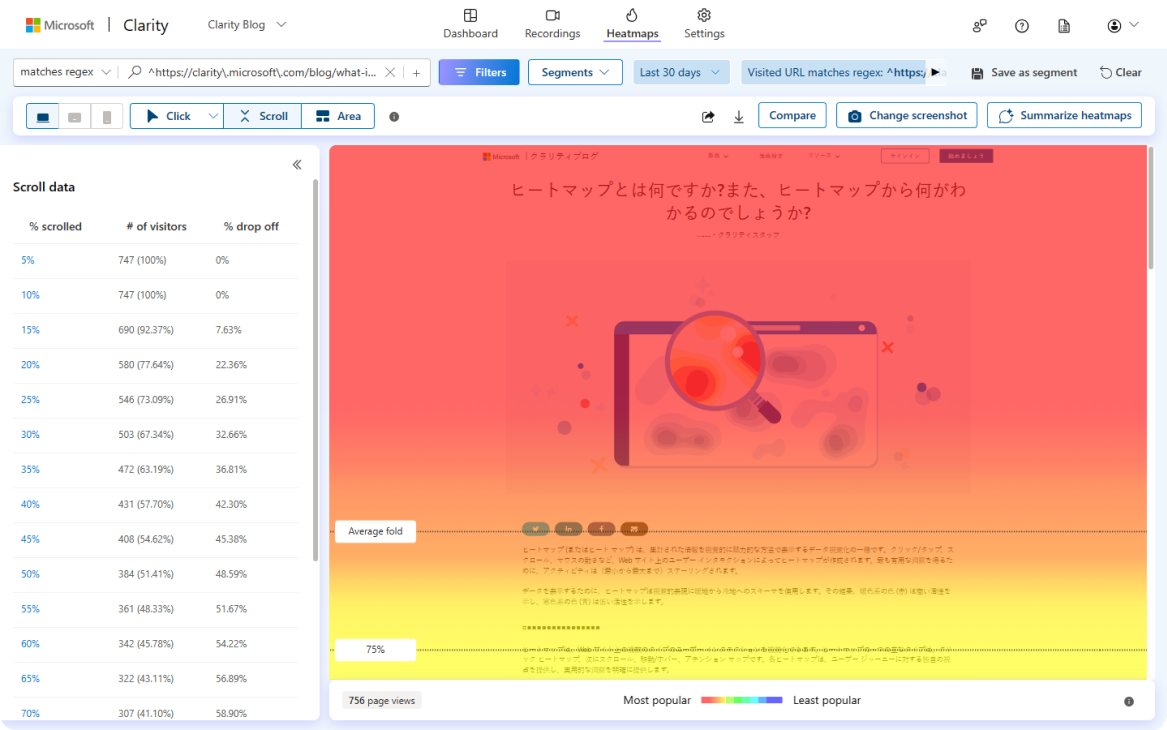
- Scroll heatmaps – Indicate how far down a page users typically scroll before dropping off. This helps in optimising content placement and layout. If key information or a CTA is placed too far down, it might never be seen by most visitors.
- Move heatmaps – Track cursor movement, offering insights into what users may be focusing on before taking action. A cursor lingering over a certain section but not clicking might suggest uncertainty or hesitation.
Why use heatmaps?
Heatmaps provide a unique perspective on user behaviour that traditional analytics tools can’t always capture. Here are some key reasons to incorporate them into your website analysis:
- Enhanced UX insights – Identify areas of friction, such as ignored buttons or confusing navigation. If users are not clicking an important CTA, it could be due to poor visibility or wording that doesn’t align with their expectations.
- Optimised conversion rates – Improve CTA placement by understanding where users naturally engage. If a “Buy Now” button is placed in an area with little engagement, it may need repositioning.
- Content performance – See if visitors engage with key content or abandon the page early. If users are dropping off before reaching the main message, the layout or copy may need adjusting.
- Complement to traditional analytics – Heatmaps work well alongside tools like Google Analytics, adding a visual layer to your data. We often utilise a heatmap when running PPC campaigns to ensure valuable prospects are navigating a page in the right way.
Organisations that use heatmaps effectively often see significant improvements in user engagement and sales.
Example:
An e-commerce website might use a click heatmap to find that users frequently click an image that isn’t linked—suggesting a missed conversion opportunity. A simple fix that may have gone unnoticed indefinitely.
How to implement heatmaps on your website
Setting up heatmap tracking is relatively simple and doesn’t require extensive technical knowledge. Here’s how to get started:
- Choose a heatmap tool – Popular options include Hotjar, Crazy Egg, Microsoft Clarity, and Lucky Orange. Each offers different features suited to various needs. Most of these tools provide a free trial/package.
- Install the tracking code – Most tools provide a small JavaScript snippet to add to your website, similar to Google Analytics. Do consider your privacy policy prior to adding tracking code though. Your privacy policy should be transparent and tell the user how this data is used.
- Define key pages to track – Focus on important areas like your homepage, product pages, landing pages, and checkout process. Tracking pages with high drop-off rates can reveal potential UX issues.
- Run the heatmap for a set period – Give the heatmap time to gather enough data for meaningful insights, typically a few weeks. Ensure you collect data from a sufficient number of visitors to avoid misleading conclusions. We’ve been running a heatmap analysis on one of our PPC campaigns for just over 4 weeks now and we’re still finding valuable data to shape changes.
Interpreting heatmap data
Once you’ve collected heatmap data, the next step is analysis. Here’s what to look for:
- High-hngagement areas – Identify sections with frequent clicks, movements, or scroll activity. These indicate areas of interest and should be leveraged for key messages or CTAs.
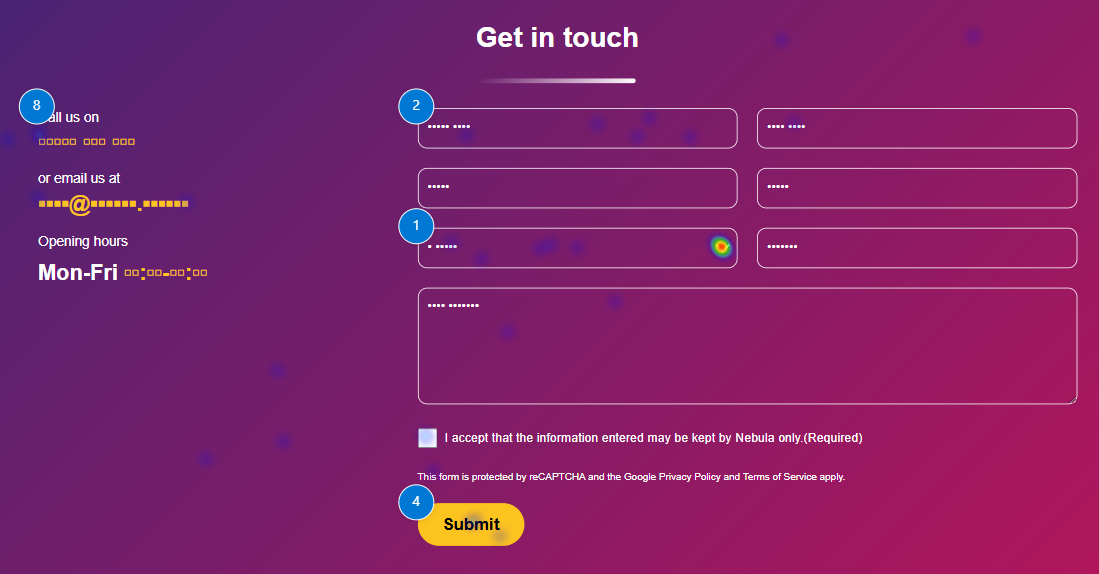
- Underperforming CTAs – If an important button isn’t being clicked, consider repositioning it or making it more visually appealing. You may also need to adjust the wording to better align with user expectations. For example, “Get Started” might perform better than “Send.”
- Scroll drop-off points – If users don’t scroll far enough to see key content, you may need to adjust your page layout. A long block of text might discourage further scrolling.
- Confusing elements – If users frequently click non-interactive elements, they may be expecting them to do something. Consider making those elements interactive or removing the confusion.
Using heatmaps to improve website performance
With insights from heatmaps, you can make targeted improvements to your website. Here’s how:
- Optimise CTA placement – Position important buttons where users naturally click.
- Improve page layout – Rearrange content based on where users focus their attention.
- Enhance navigation – Identify and fix navigation elements that users struggle with.
- Validate A/B tests – Use heatmaps alongside A/B testing to ensure changes lead to real improvements.
For instance, if users are clicking on a secondary link instead of the main CTA, you may need to redesign the page to better guide them toward the intended action.
Common mistakes to avoid when using heatmaps
Heatmaps are powerful, but they’re not infallible. Avoid these common pitfalls:
- Misinterpreting Data – Don’t jump to conclusions without considering other metrics. For example, a high click rate on a CTA doesn’t necessarily mean it’s effective—it could mean users are confused and clicking multiple times.
- Ignoring Other Analytics – Combine heatmaps with bounce rates, session duration, and conversion tracking for a complete picture.
- Overreacting to Small Sample Sizes – Ensure you have enough data before making changes. A small sample may not represent typical user behaviour.
Case study: A real-world example of heatmap success
Let’s consider a small online retailer struggling with abandoned carts. Using a click heatmap, they discovered that users were clicking an unlinked product image instead of the “Add to Basket” button. By making the image clickable and repositioning the CTA, they increased conversions by 15%.
Another example is a SaaS company that found their signup button was placed in an area with little engagement. After testing different placements, they moved it higher on the page and saw a 20% increase in signups.
Conclusion & next steps
Heatmaps are an invaluable tool for understanding website visitor behaviour. They offer deep insights into how users interact with your site, allowing you to optimise layouts, improve user experience, and boost conversions.
If you haven’t yet explored heatmaps, now is the time to start. Choose a tool, set up tracking, and begin gathering data to refine your website’s performance. By making small, data-driven changes, you’ll create a more engaging and effective online presence for your visitors.
Ready to see how heatmaps can transform your website? Start tracking today and unlock valuable user insights!